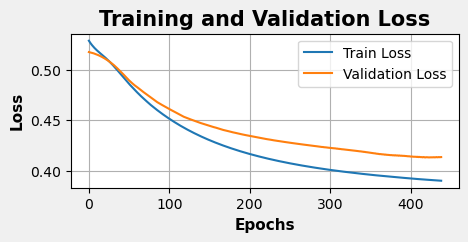
Autoencoder
Below is a plot showing the Reconstruction Loss history for both the training sets and validations sets. The model appears to converge after roughly 400 epochs.
Clustering
Once the autoencoder compressed the input features into a 2-dimensional latent space, I applied the KMeans clustering algorithm to group the data points into distinct clusters.
Process Overview
To identify the optimal number of clusters, I iteratively evaluated different cluster counts using:
-
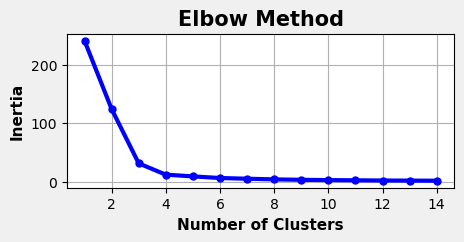
Elbow Method: Visualizing the inertia values to detect diminishing returns in variance reduction.
-
Silhouette Scores: Quantifying the compactness and separation of clusters.
Key Observations
The inertia plot below shows the variance explained by increasing the number of clusters. Significant decreases in inertia occur from 2 to 4 clusters, suggesting that these clusters effectively capture the natural groupings in the data. Beyond 4 clusters, the slope flattens, indicating diminishing improvements in cluster separation.
Since the latent space has only two dimensions, I visualized the clusters in a 2D scatter plot. The resulting visualization revealed four distinct groupings. Data points appear to cluster into separate regions, suggesting the autoencoder effectively compressed complex relationships from the original dataset into the latent space.
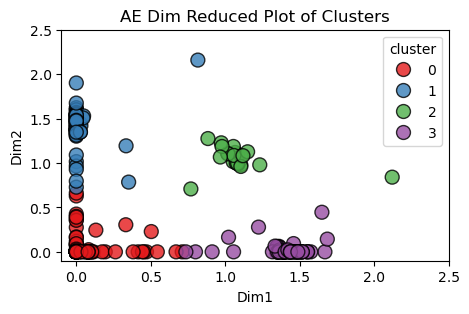
A high Silhouette score of 0.85 indicates the clusters are distinct and well separated.
Cluster Distribution
The number of respondents in each cluster is as follows:
-
Cluster 0: 167 respondents
-
Cluster 1: 72 respondents
-
Cluster 2: 23 respondents
-
Cluster 3: 70 respondents
Interpretation
The latent space representation preserves the relationship between the original input data and the cluster assignments. This allows for meaningful comparisons and insights between clusters by analyzing original survey features.
Airline Frequency Ratings
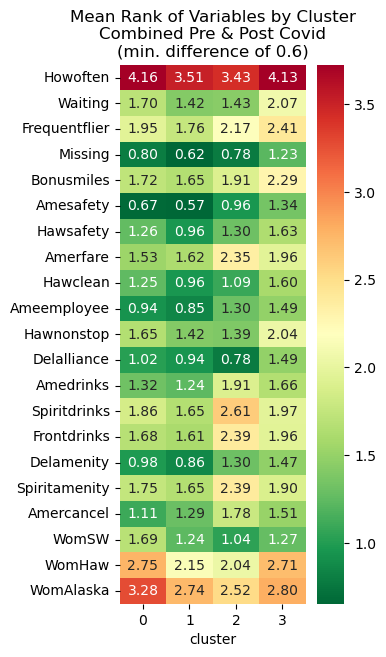
The survey question, “How frequently do you fly with each airline?”, allowed respondents to rate how frequently they fly with each of the 9 different airlines on a scale from 1 (frequently) and 4 (Never). The heatmap below summarizes the average frequency ratings for each cluster across the nine airlines.
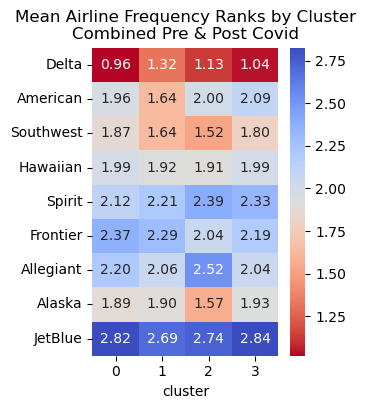
This feature is critical for understanding customer airline preferences. A few interesting patterns to point out include:
-
Delta Airlines consistently has the lowest average score across all clusters, indicating it is the most frequently flown airline from this survey.
-
JetBlue has the highest average score, making it the least frequented airline in this study.
Key Features Differentiating Clusters
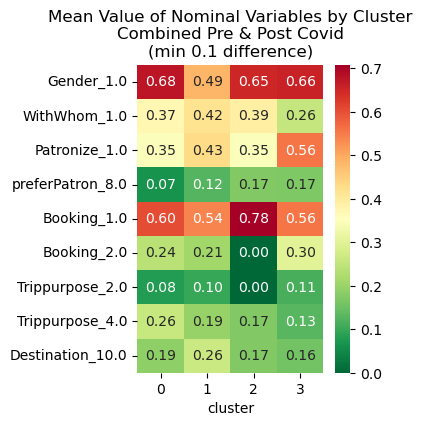
To understand what differentiates the clusters, I analyzed survey features with the greatest variation between clusters. Only features where the difference in average ratings exceeded a specified threshold were included in the following visuals. The heatmaps below highlight these differentiating features.
Note: Each of the nominal variables needed to be factored out into ‘dummy-variables’ in the dataset. Thus, they are all binary and on a different scale than the ordinal variables, so I separated them out on their own heatmap.
Cluster Profiles
Cluster 0: “Loyal but Infrequent”
Demographics & Travel Behavior:
- Predominantly male (≈68% male) and mostly married (≈87%).
- These customers fly infrequently (average Howoften ≈4.16 on a scale where lower values mean more frequent travel).
Service Ratings:
- They provide very positive ratings on several service aspects (for example, excellent perceptions of American Airlines’ fares and safety).
- Overall, their service experiences are favorable, with few glaring issues.
Actionable Insights:
Engagement: Introduce loyalty incentives and special offers to encourage increased travel frequency. Service Continuity: Maintain high service standards and monitor any emerging issues, ensuring that infrequent flyers continue to have a positive overall experience.
Cluster 1: “Frequent, Satisfied Flyers”
Demographics & Travel Behavior:
- This group shows a more balanced gender mix (about 49% male) and a slightly lower marriage rate (≈79% married), which may indicate a younger or more dynamic segment.
- They are frequent flyers (Howoften ≈3.51).
Service Ratings:
- They rate safety, in-flight services, and onboard amenities very highly (e.g., low scores on measures like Amesafety and Spiritdrinks indicate strong satisfaction).
Actionable Insights:
Loyalty Programs: Focus on premium rewards and exclusive benefits to retain these brand advocates. Sustain Excellence: Continue delivering consistent, high-quality service that meets their elevated expectations.
Cluster 2: “Frequent but Critical”
Demographics & Travel Behavior:
- Similar in composition to Cluster 0 (roughly 65% male, 87% married).
- They travel frequently (Howoften ≈3.43).
Service Ratings:
- This segment is notably more critical across several dimensions. For instance, they rate in-flight beverage quality (Spiritdrinks), fare value (Amerfare), and even safety (Amesafety) less favorably—indicating higher expectations.
- Their responses suggest that while they fly often, any service lapse is keenly felt.
Actionable Insights:
Service Improvements: Prioritize enhancements in areas where they express dissatisfaction (such as drink quality and safety measures). Targeted Communication: Clearly communicate any improvements or changes in service. Using pilot programs or direct feedback channels may help convert their critical view into satisfaction.
Cluster 3: “Infrequent and Cautious”
Demographics & Travel Behavior:
- Like Cluster 0, this group is largely male (≈66% male) and predominantly married (≈84%), potentially representing a more traditional customer base.
- They are infrequent flyers (Howoften ≈4.13).
Service Ratings:
- They tend to rate aspects like waiting times and overall safety somewhat less favorably (for example, waiting scores are higher, indicating longer perceived delays).
- Their overall approach is more cautious, making each travel experience particularly impactful.
Actionable Insights:
Building Trust: Focus on reducing friction points (such as waiting times) and emphasize clear, reassuring communication about safety protocols. Incentivization: Consider trial incentives or flexible booking options to gently encourage more frequent travel while building confidence.
Overall Strategic Recommendations
Personalize Offers:
- Cluster 1 should be rewarded as loyal brand advocates with exclusive perks.
- Cluster 2—although frequent—requires targeted service enhancements to address their higher expectations.
- Clusters 0 and 3 can benefit from strategies that stimulate more travel while ensuring that any service shortcomings (even minor ones) are addressed promptly.
Monitor Key Metrics:
- Regularly review both direct service measures (e.g., safety, fare value, onboard experience) and any reputation feedback that stands out, ensuring that improvements are aligned with customer expectations.