Project Overview
To address the complexities of this data, an autoencoder framework was employed to extract low-dimensional latent representations of the survey responses. KMeans clustering was then applied to the latent spaces to identify distinct customer segments.
Methodology
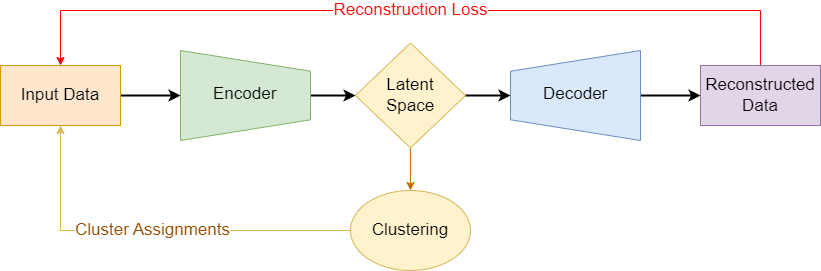
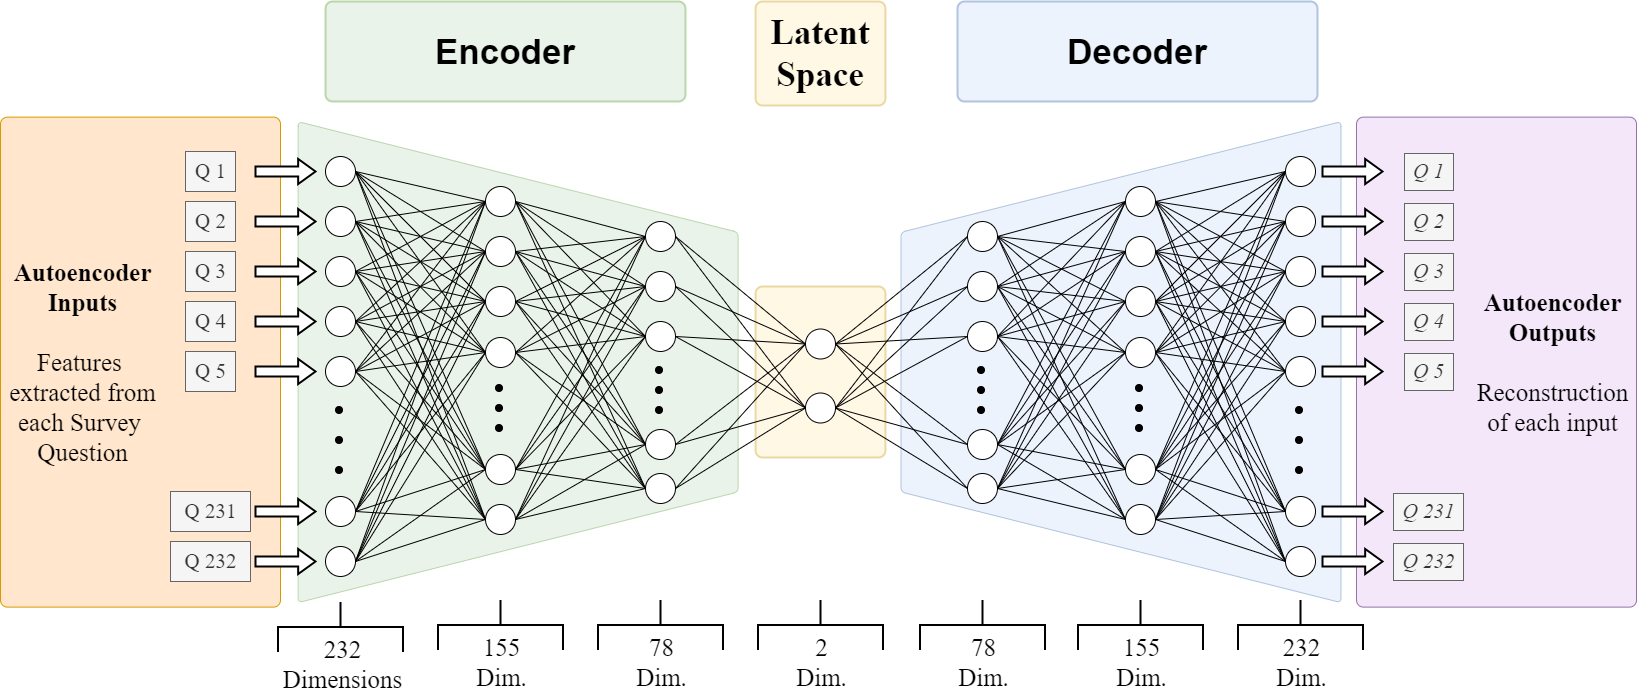
Autoencoder
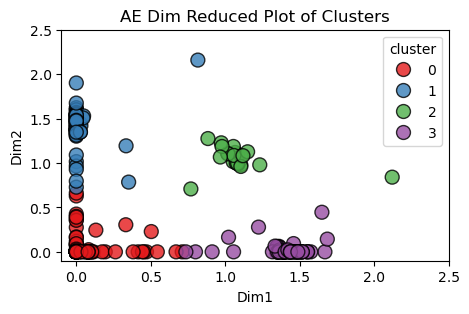
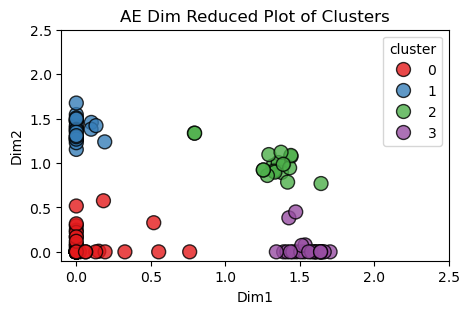
Cluster Visualizations
Below is a scatter plot of the reduced dimensions of the latent space with KMeans cluster assignments denoted by color. This is the output when using the entire combined dataset through the processes described above.
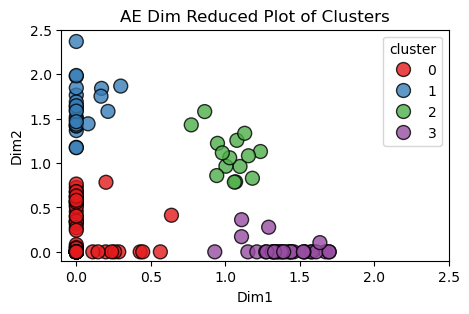
Covid Split
This dataset is divided evenly between data collected before and after the 2020 Covid lockdown. I will first analyze the entire dataset, and then apply the same methods separately to the pre- and post-lockdown segments.
Below is a comparison of the latent space clusters using the same scatter plot format as the previous section.
Imputations Methods
Throughout this project, I compared results when using three different imputation methods for missing values throughout the dataset (blank responses to survey questions). These methods include K-Nearest Neighbor (KNN), Mode, and random gaussian noise.
While the imputation method did not tend to differentiate clustering results, I chose to focus on the KNN method for its flexible and logical imputation.